Decathlon — Application Facilité
Designing a data platform that transforms user test results into clear, actionable visual insights.

We needed to design an experience that was both insightful and lightweight, helping teams identify what worked for users and where products could improve.
November 2024 – February 2025
My Role
UX/UI Designer — focused on:
User flow mapping
Low- and high-fidelity prototyping
Data visualization design
Dashboard interaction design
Usability testing
Client
Decathlon
The challenge
Decathlon collects large volumes of user test data to evaluate how their products perform in real-life scenarios.
However, these insights were scattered across spreadsheets, reports, and emails — making it difficult for teams to see patterns, compare products, or act quickly on results.
The goal: design a centralized, intuitive platform that transforms raw test data into meaningful visualizations to guide product decisions.
Note* The data presented in these screenshots is entirely fictional and does not reflect any real internal figures, in accordance with confidentiality agreements.

This platform wasn’t just about visualizing data — it was about empowering teams to run, track, and interpret product tests from start to finish.
Data Visualization & Customer Experience
Rich data visualizations at the core
-
Designed detailed reports that transform raw test data into accessible insights — including product performance over time, satisfaction scores, and tester feedback.
-
Built comparison tools to help teams evaluate multiple products side by side, using dynamic filters and custom KPIs.
-
Focused on clear, actionable visual elements — from interactive charts and scorecards to visual flags for common issues.
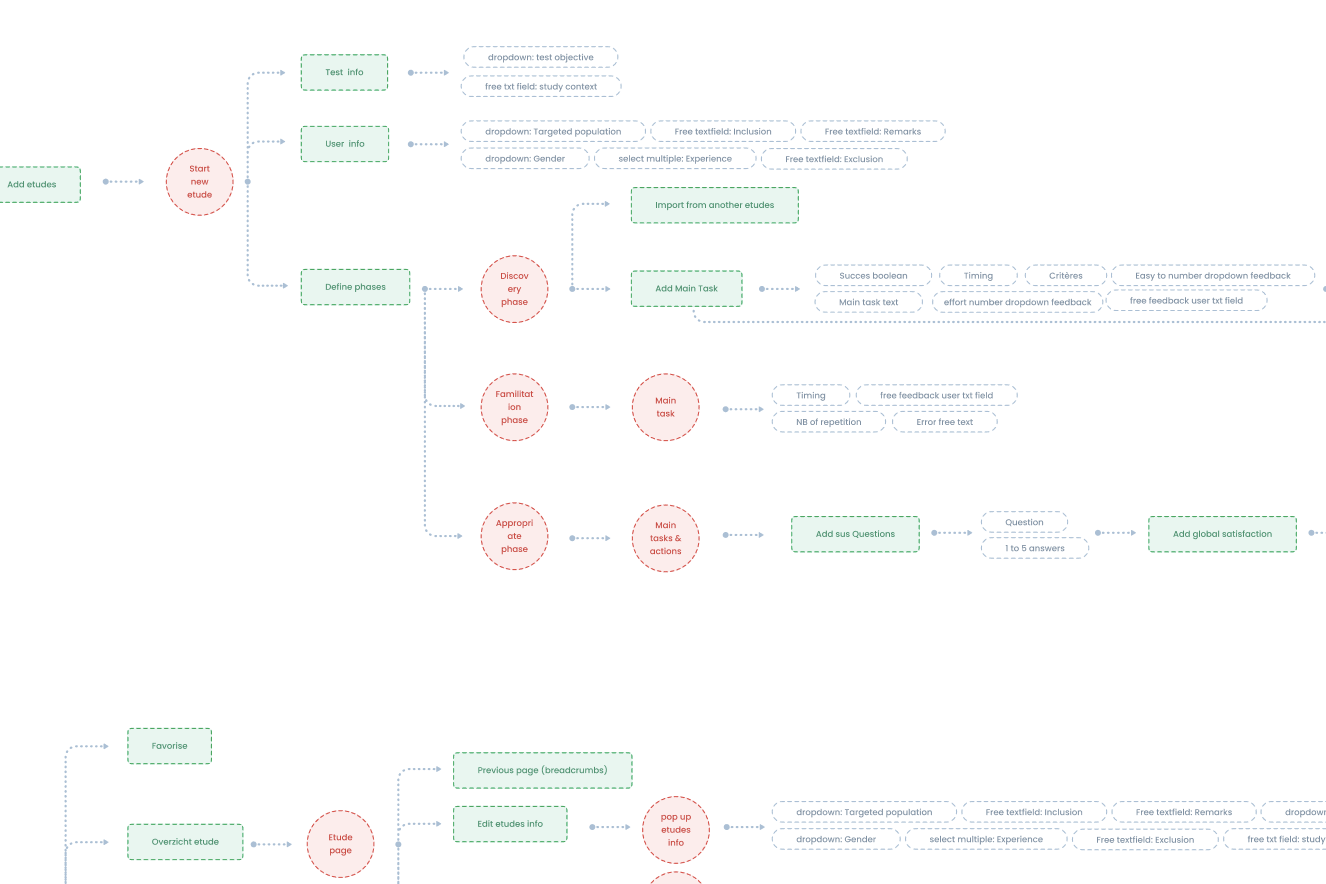
From data analysis to testing workflow
The platform also needed to support the entire testing journey:
-
Set up a test environment for a specific product
-
Assign and complete questionnaires
-
Follow the progress of a live test in real time, with immediate visibility into early trends
Personalized dashboards
-
Users can personalize their dashboard by choosing which studies or product tests they want to follow closely.
-
This ensures relevance and avoids information overload, especially for users managing multiple projects at once.
Where We Are Now
The platform is currently being rolled out internally, with teams gradually integrating it into their testing workflows.
Initial feedback highlights the value of having centralized, visual insights and the ability to track tests live.
Product teams now feel more in control — not only of the data, but of the full testing process.
